We Looked At Every Way Finance Teams Are Trying To Fix Month-End In 2026. Here Are The 5 That Actually Change Anything, Ranked.
Four of them need budget, a project plan, or somebody else's permission. One of them can be done on a Tuesday afternoon with the file you already inherited. The number 1 spot is the one nobody in finance is selling.
| 5. Hire someone to help | 3.9 |
| 4. Buy a planning platform | 5.2 |
| 3. Ask your accountant or auditors | 6.1 |
| 2. Point AI at the workbook | 7.4 |
| 1. Document the trail | 9.6 |
(London) Almost every finance lead we speak to describes the same inheritance. The workbook that produces the monthly pack was not built by them. It was built by somebody who has since left, extended by somebody else who has also left, and handed over in an afternoon that did not cover the parts that mattered.
They know how to run it. That is a different thing from knowing how it works. Which cells are safe to touch and which are load-bearing was never written down, and the people who knew are not here. What exists instead is a working map, assembled over years, mostly by finding out what breaks.
Then somebody in a meeting looks at a figure on page four and asks where it came from. It came out of the file. That is true and it is not an answer, and the answer that would end the question was never handed over with the workbook.
Over the past four months we have reviewed what finance teams actually do about this, from hiring through to the AI tools currently being sold to them, and what separates the reports that survive a handover from the ones that quietly depend on one person.
The number 1 approach surprised us, because it is the cheapest thing on this list and the only one nobody is selling.
What to look for: the only question that separates these five
Every comparison of reporting tools scores the wrong things. Speed, integrations, dashboards, seat price. None of those decide whether the report can be handed over. One question does.
When somebody asks where a number came from, can you answer in the meeting?
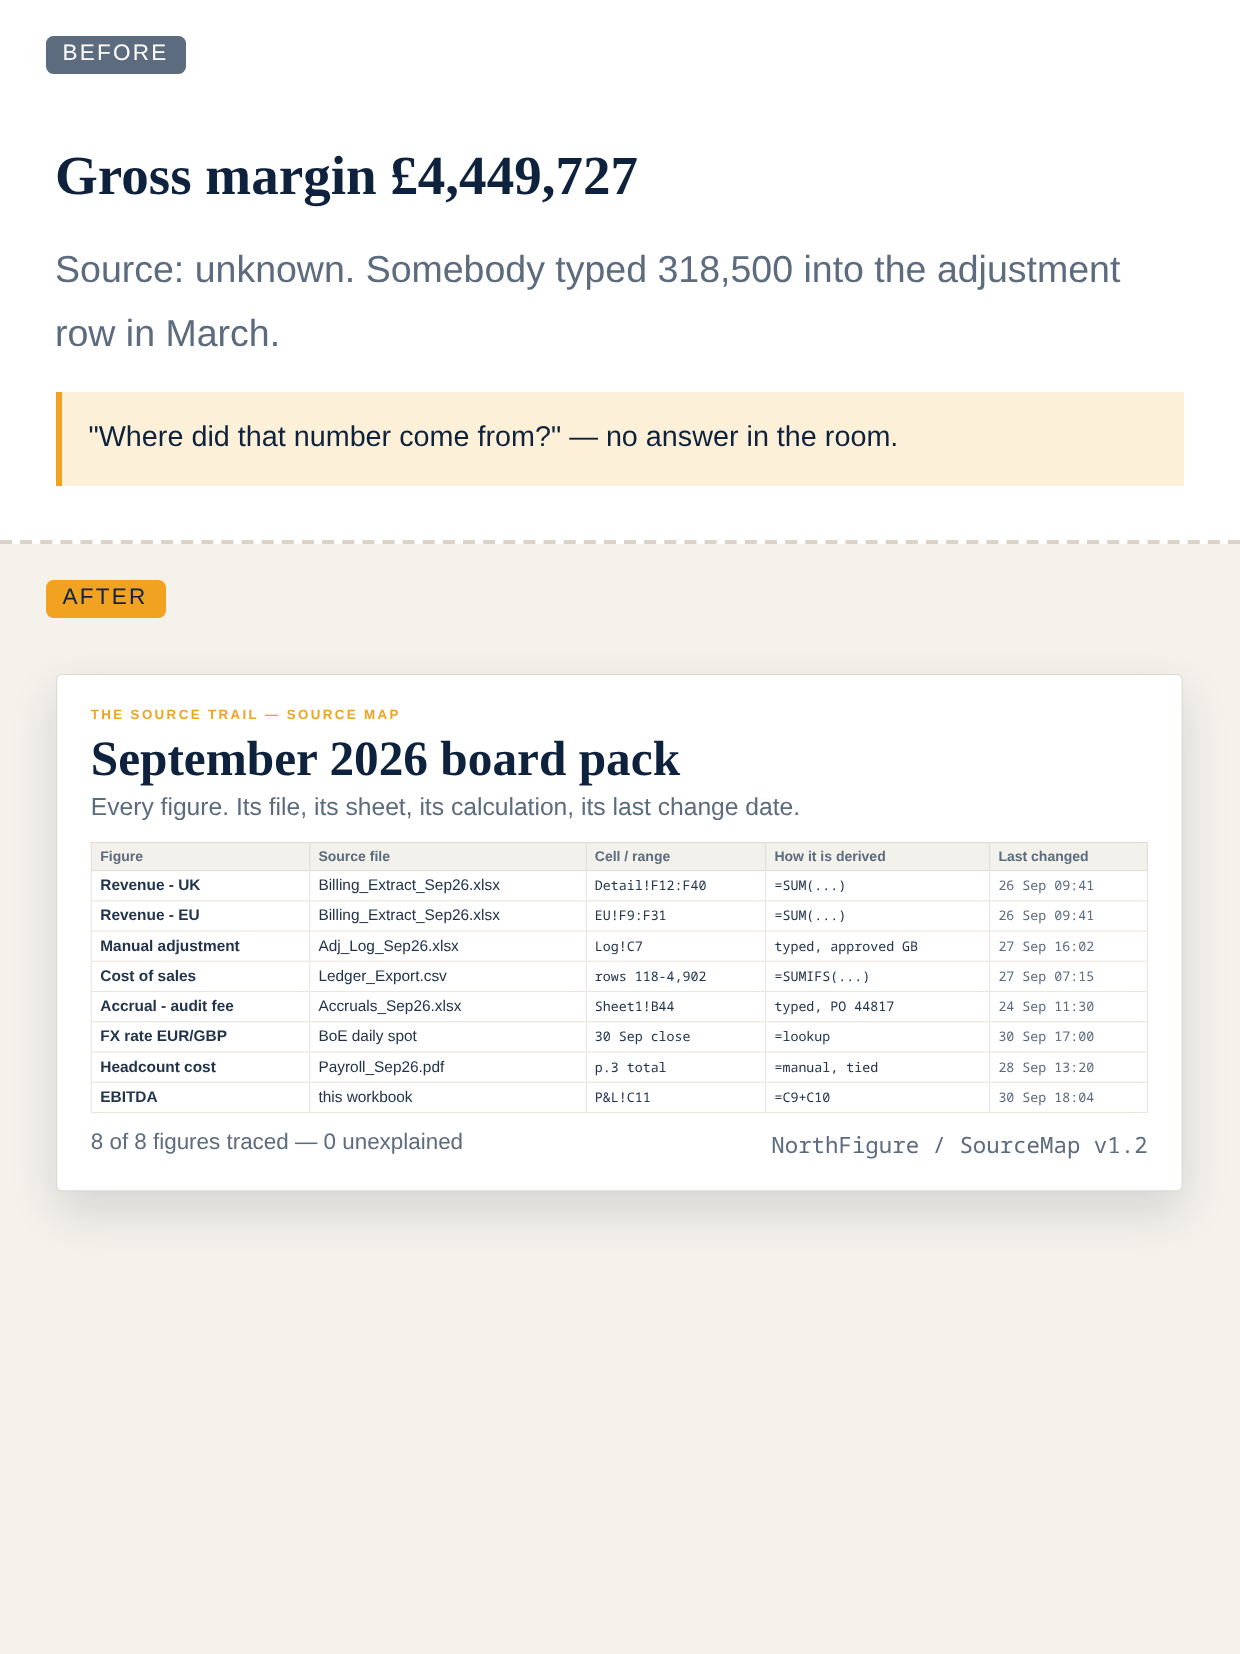
If it can be answered, the report is an asset and anyone can run it. If it cannot, the report is a dependency wearing a spreadsheet costume, and every month you keep it alive you make it harder to leave.
This is not a fringe worry. 42% of finance leaders say they do not trust their own financial data, and in the UK that figure is 56%. Here are the five approaches in the order they answer the question, worst to best.
5. Hire someone to help
The instinct is sound. The close is late because one person is doing too much, so add a person.
But look at what you would be handing them. You would be explaining a workbook you did not write, whose original logic left with somebody else, in which you know what is safe to touch largely because you have learned what is not. Onboarding is not training, it is one person passing on a partial map. Most finance leads give up somewhere around the third explanation and take the work back.
There is a harder version of this problem underneath. You are not just staffing a gap. You are staffing a gap that moves.
Verdict: more hands on a report nobody else can follow. It gives the confusion an audience.
| Personnel inadequacies as root cause of disclosed material weaknesses | 20.3% |
| Finance professionals expecting their next role to be outside their current organisation | 58% |
4. Buy a planning platform
The serious option, and the one that gets scoped in board papers. Lift the reporting out of Excel entirely and into something built for it.
What it costs is easier to check than you might expect, because public bodies have to publish what they pay.
| Financial planning and analysis platform, one public contract award (excl. VAT) | £378,969.80 |
| Planning-platform implementation project, approx. four months (no licence included) | £50,000 |
| Implementation services, per person per day (published rate card) | £450 |
Then there is the part that never makes the board paper. A UK planning consultancy puts a focused deployment at "8-12 weeks from kickoff to go-live", and one vendor's own implementation guide asks the administrator to "dedicate an average of 1 to 1.5 days a week of project time throughout the course of the implementation". That administrator is you. You are buying the platform to get the first week of the month back, and the first three months of it cost you a day a week.
The implementation also starts with your data, not with the software. The same consultancy is blunt about it: "A better front end on bad data is still bad data. Sort out the source systems first." Which means the project you were avoiding is the first phase of the project you bought.
The deeper issue is what actually moves. Your untraceable figures do not become traceable by changing the software they sit in. They become untraceable somewhere more expensive, and now with an integration between them.
Verdict: it relocates the problem, charges an annual fee for the move, and asks you to do the moving.
3. Ask your accountant or auditors to look at it
Reasonable, and the cheapest call to make. They already know your numbers, and reviewing processes is genuinely something they do.
The difficulty is that it is a separate engagement, and it is priced like one.
| Audit partner or director, per hour (2025/26) | £440 |
| Audit manager, per hour (2025/26) | £243 |
| EY, per day at "Ensure or Advise" grade | £1,575 |
| Deloitte, per day at the equivalent grade | £1,825 |
| Deloitte, per day at its most senior grade | £2,450 |
It is worth being clear about what the money buys. When Luton Council wanted an outside view of how well its finance function worked, it paid £71,500 for a review of "culture, skills and processes", running from July to December. That is a real piece of work by serious people.
It is also a report about your reporting. And when it is delivered, the thing that produced it has gone. The next time somebody asks where a figure came from, you are back in the same meeting saying the same sentence.
Verdict: a diagnosis you pay for, with the cure sold separately.
2. Point AI at the workbook
The closest of the four to being right, and most people reading this have already tried it.
It is also where the damage gets done, for a reason that has nothing to do with the model being stupid. Columbia Business School found AI agents fill spreadsheets with hardcoded values instead of formulas, which makes the resulting model unauditable. That is precisely the condition you were trying to escape, arrived at faster.
So you get an answer that reads beautifully and no way to check it. You spend forty minutes verifying something that was supposed to save you time, and quietly stop using it.
You were not wrong to try it. You were wrong about what to ask it for.
Verdict: it gives you a faster answer and no way to defend it. Right tool, wrong job.
| Ask for the answer "What is the variance on page four?" | Unverifiable |
| Ask for the trail "Which cell is that figure in, and what feeds it?" | Checkable |
1. Document the trail
The only approach on this list that survives you leaving the room. It is also, precisely, the thing that should have been handed over with the workbook and was not.
You do not migrate, rebuild or replace anything. You take the workbook you already have and you establish, figure by figure, where each number came from: which file, which sheet, which calculation, and when it last changed. The output is one page. When somebody asks, you turn the screen round.
| Figure | Trade debtors, page 4 |
| Source file | AR_Ageing_Sep26.xlsx |
| Sheet and cell | Summary!D18 |
| How it is derived | Sum of Detail!F4:F212, less credit notes |
| Last changed | 2 September 2026 |
- Nothing gets migrated. The file stays where it is, in the format the business already reads. No implementation, no data-cleansing phase, no integration to maintain.
- It reverses what AI is for. You stop asking for answers, which is the thing it cannot be trusted with, and start using it to build the trail, which is checkable by definition. Every claim points at a cell you can open.
- It is not a month-end method. It is a traceability method. Month-end is simply where the question gets asked most often, which makes it the best place to prove it works.
- Con, and it is a real one: it is a method, not a button. Somebody has to sit down with the actual file for an afternoon. If nobody in your organisation will do that, none of this happens, and the other four options are still available to you.
Verdict: it is the only one where the answer to the question exists before the question is asked.
North Figure publishes the eleven steps, the macro and the Source Map in full.
What that looks like on a real workbook
We asked to see the finished article rather than a description of it. Below is a completed Source Map for a September board pack: every figure on the page, with the file it came from, the exact cell, how it is derived, and the date it last changed.
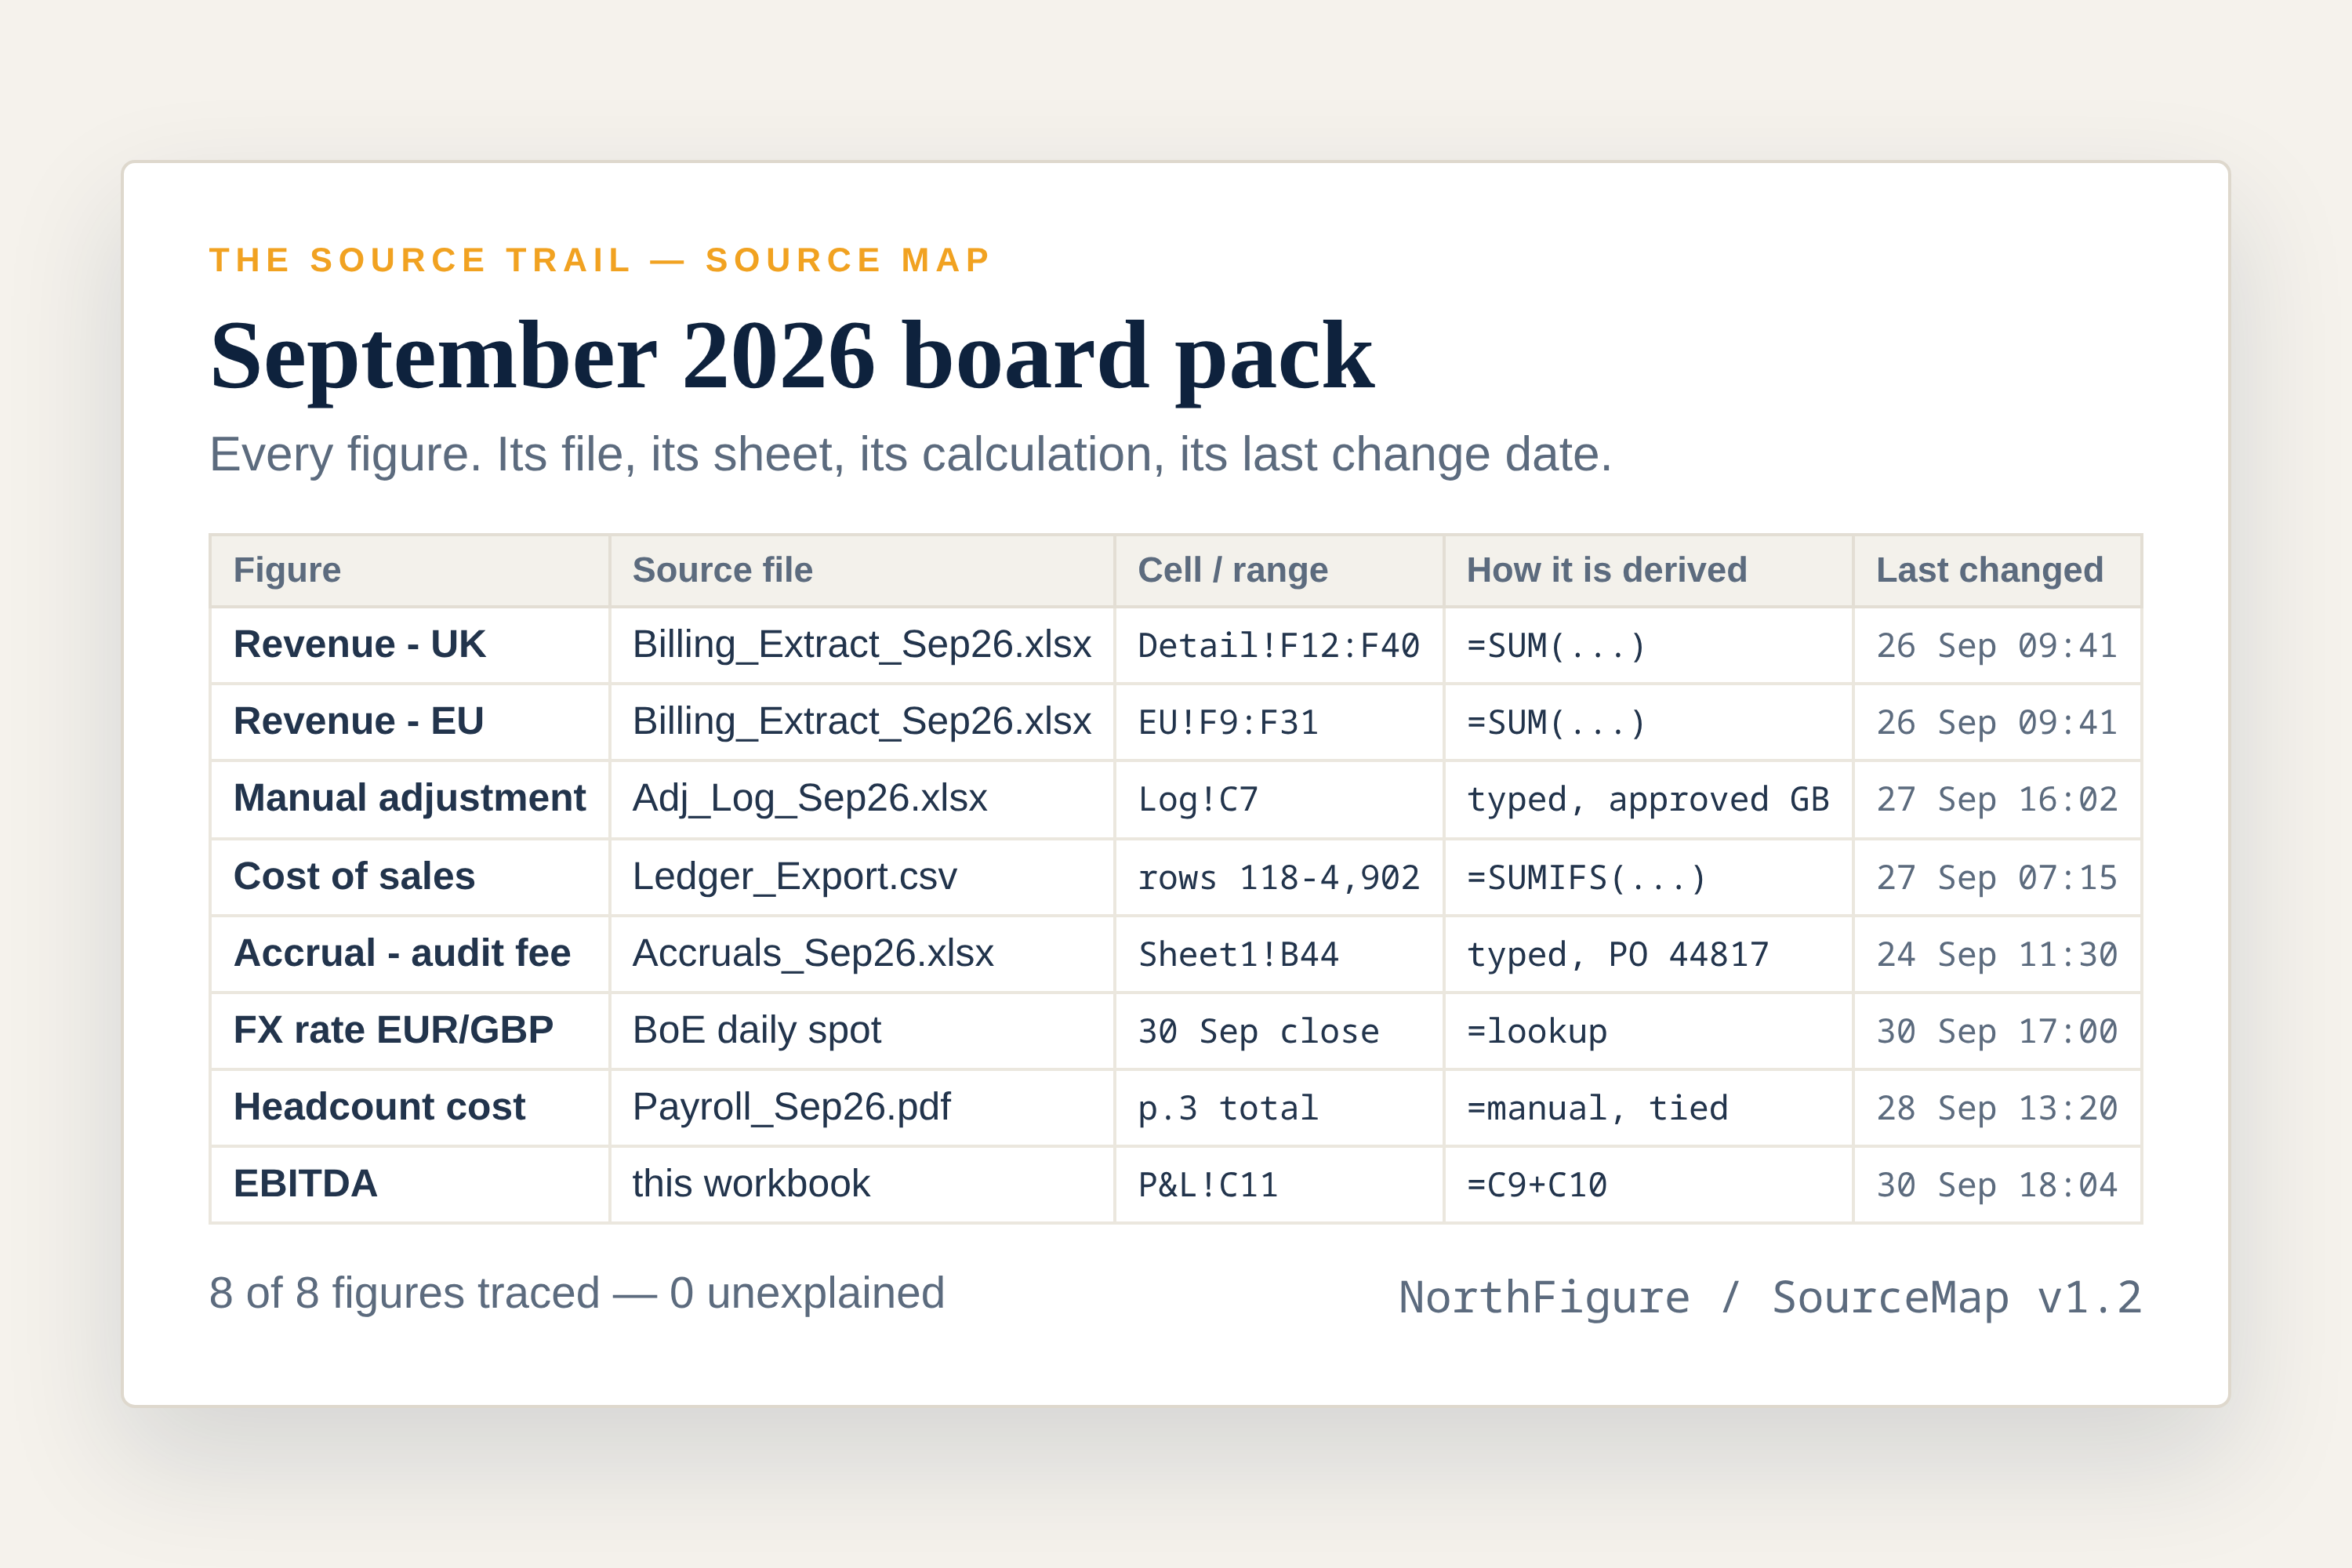
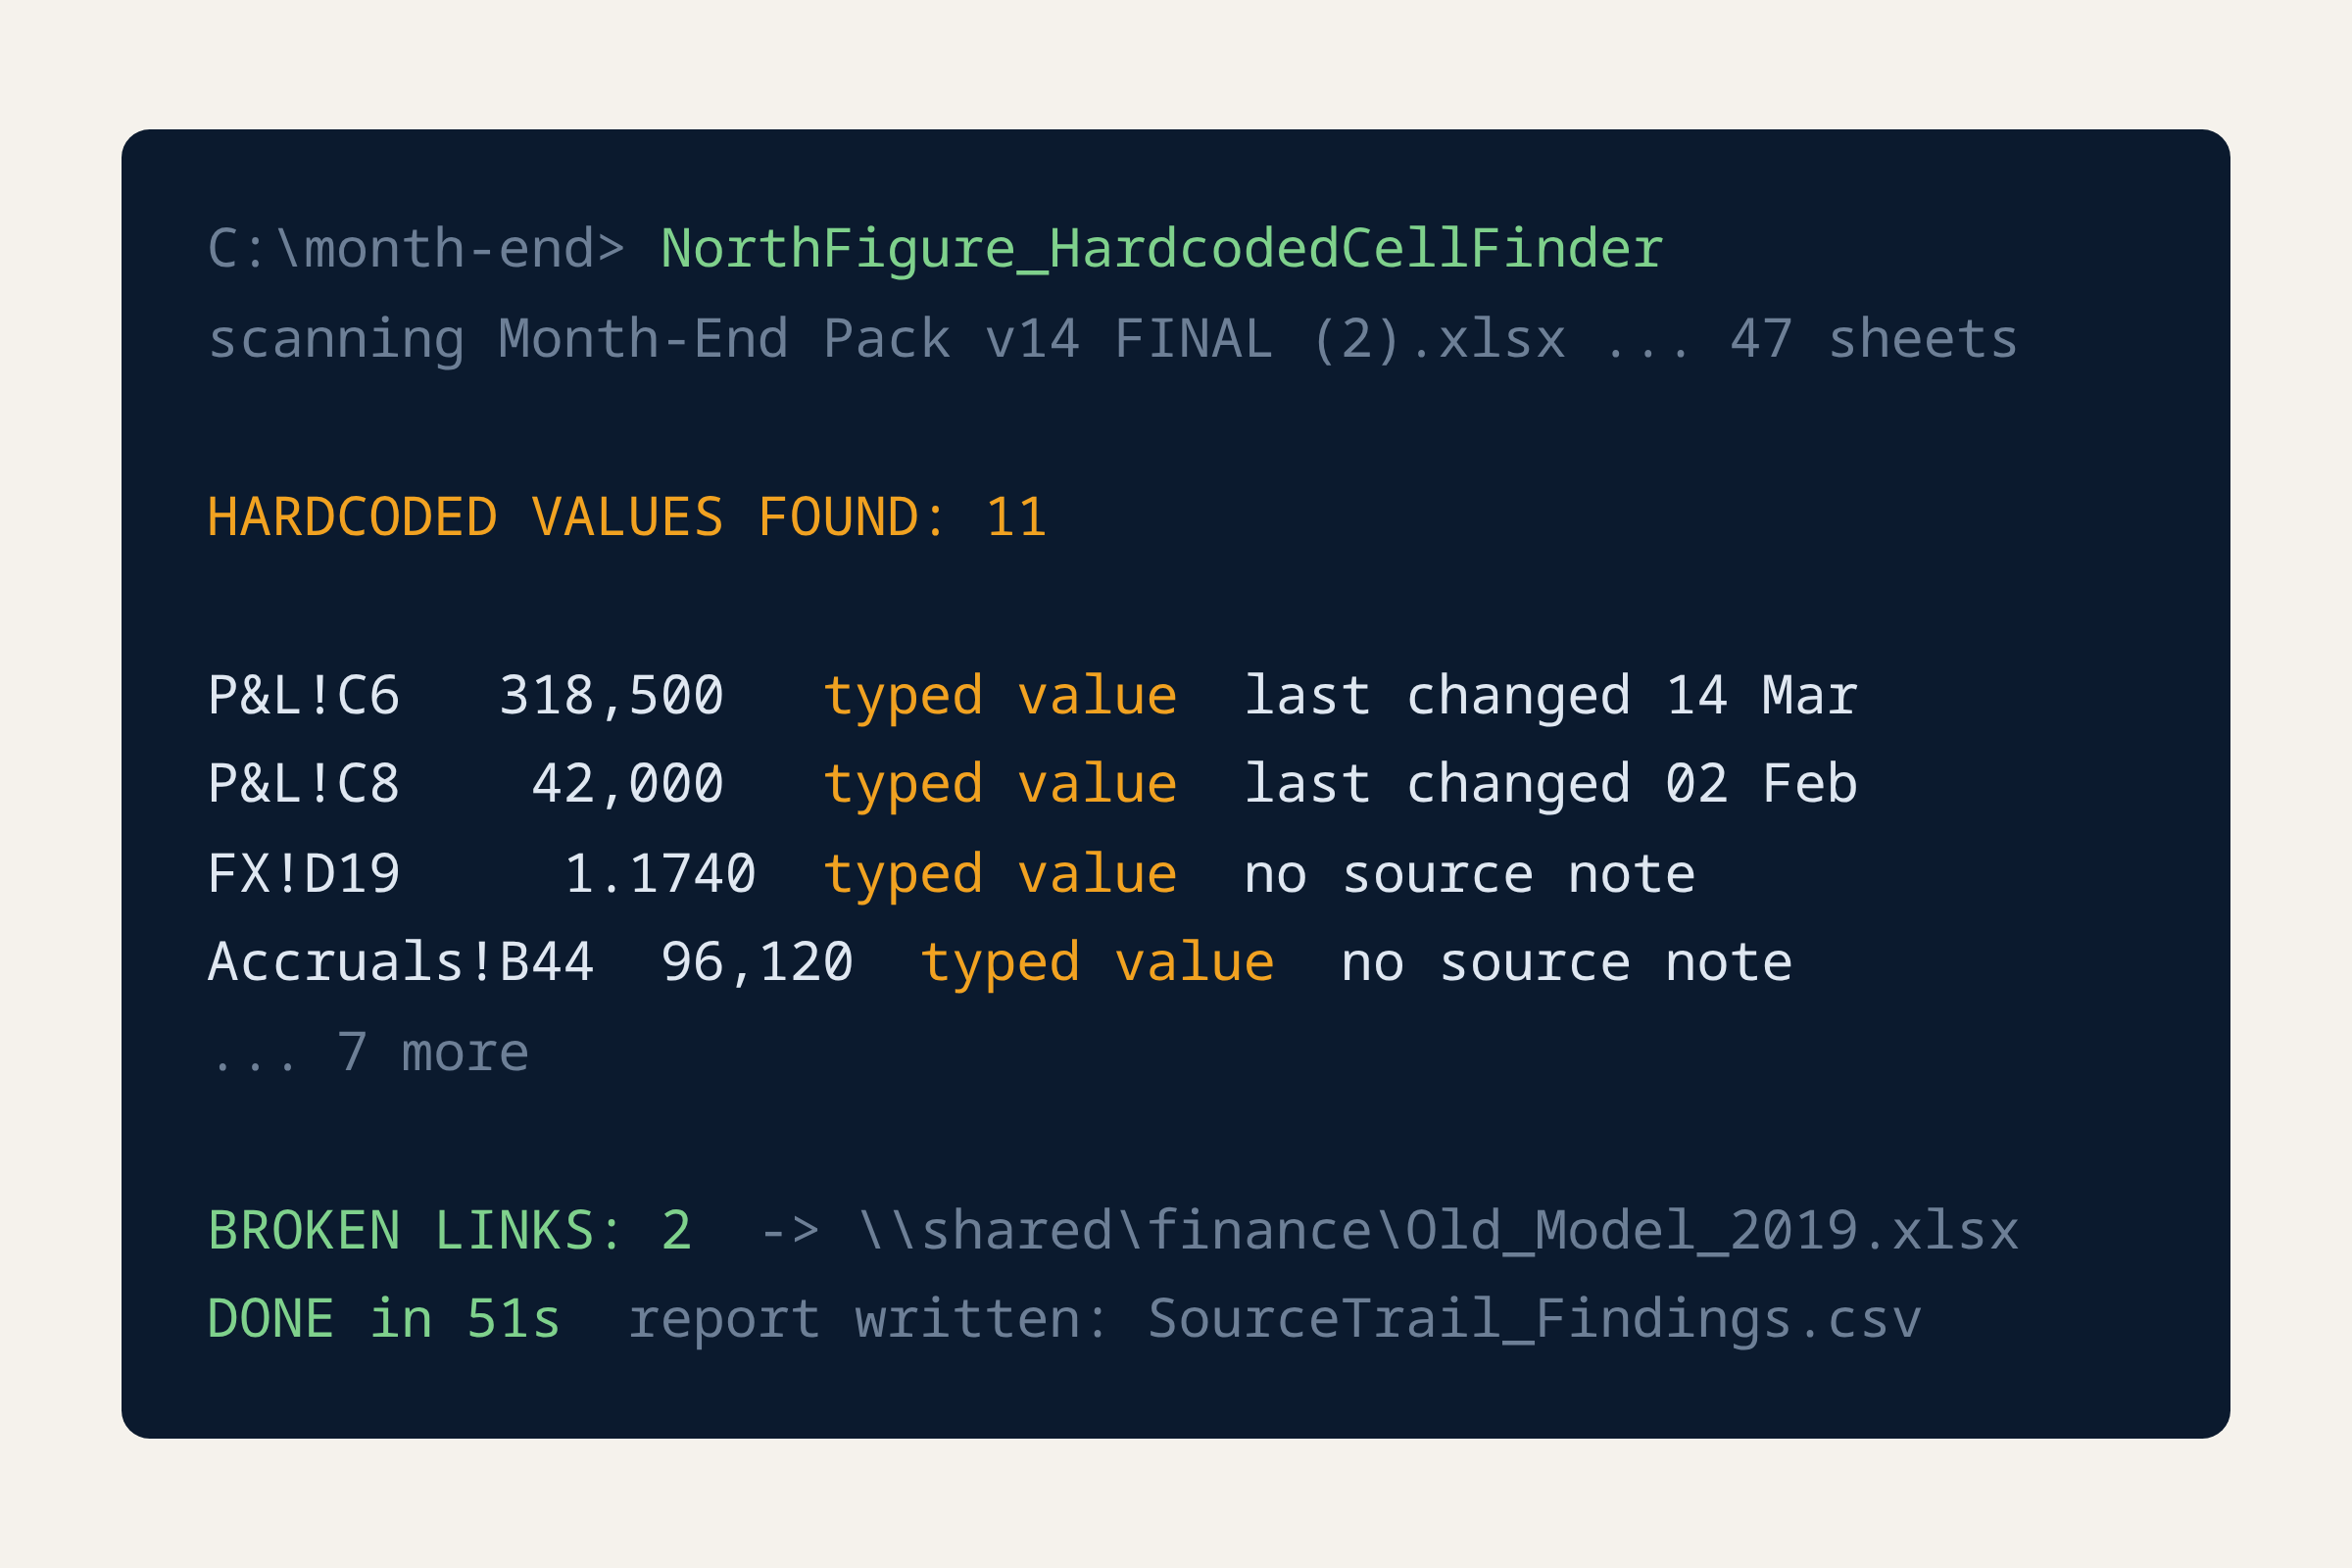
Getting there starts with finding what cannot be explained, and that part is a script rather than a prompt, so it returns the same answer every time. We watched it run against an unedited month-end pack.
Who built it. The method ranked first was developed by Brian Booden, who runs BB Data Services, an independent UK analytics consultancy, and works on data governance and reporting architecture for a living. He has been named a Qlik Luminary nine times. He also publishes this report, which is what the disclosure at the top of the page says. On an article about knowing where a number came from, it would be strange not to tell you where this one came from.
What to avoid: why most attempts at this fail
Plenty of finance teams have tried to document their reporting and abandoned it. Almost always for one of three reasons.
They document the file instead of the figures. A tab-by-tab description of the workbook is not a trail. It reads well and answers nothing. The unit is the number, not the sheet.
They try to fix the spreadsheet at the same time. That is two projects wearing one deadline. Trace first, tidy later, or you finish neither.
They start with the worst workbook they own. The instinct is to attack the biggest problem. One finished trail beats four abandoned ones, so start with a report you can actually finish.
You were not wrong to try. You were trying to do it to everything at once.
Who this is not for
If you built your reporting yourself and it already survives you being away, you do not need this. If you want a platform that replaces Excel, this is not that and will disappoint you. And if nobody in the organisation will spend an afternoon on it, no method fixes that.
If that is not you, the fastest version is not a project. North Figure publishes the whole method: the eleven steps, the macro that finds every typed-in figure in the workbook you already have, and the Source Map that proves where each one came from. You run it on your own machine and nothing leaves it.
Number 1 pick: document the trail on one report
One report, one afternoon, your own file. You bring the workbook. The method does the rest, and you never send anyone your data.
Where our figures came from
We hold ourselves to the same standard as the number 1 pick. Every figure in this report is checkable.
- Financial planning and analysis platform contract, £378,969.80 excluding VAT: UK Find a Tender award notice 072862-2025, published 11 November 2025.
- Planning-platform implementation project, £50,000 over roughly four months: UK Contracts Finder award notice, published 17 April 2023.
- Implementation services at £450 per person per day: Deloitte LLP published pricing document, G-Cloud 14, UK Government Digital Marketplace, April 2024.
- "8-12 weeks from kickoff to go-live" and "A better front end on bad data is still bad data. Sort out the source systems first.": Bolt Consulting, UK EPM consultancy, published 15 January 2026.
- "1 to 1.5 days a week of project time throughout the course of the implementation": Vena Solutions implementation guide, published 27 June 2025.
- Audit partner or director £440 an hour, manager £243 an hour, 2025/26: PSAA published rate card.
- EY £1,575, Deloitte £1,825 and £2,450 a day: the firms' own published pricing documents, G-Cloud 14, UK Government Digital Marketplace, 2024.
- £71,500 finance function review, "culture, skills and processes": UK Contracts Finder award notice, Luton Borough Council, published 14 July 2025.
- Personnel inadequacies at 20.3% of disclosed material weaknesses; 58% of finance professionals expecting to move; 42% and 56% data-trust figures; Columbia Business School on hardcoded values: as published and cited at get.northfigure.com.